
Combating Aflatoxin Poisoning Using Smart IoT and Predictive Analytics for Sustainable Food Systems
By Emmanuel Mbije, Josiah Justinian, Jackline justus
INTRODUCTION
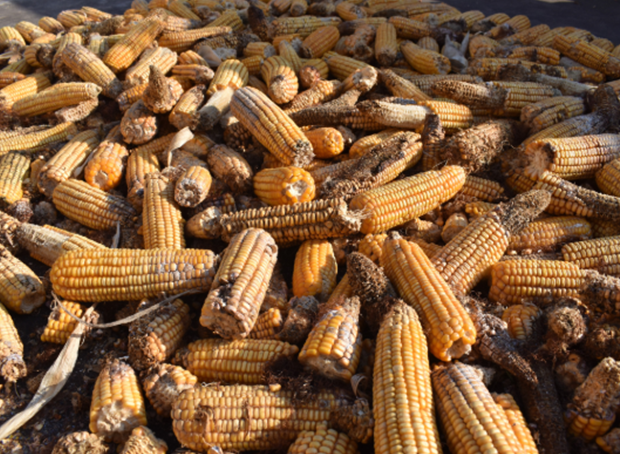
Aflatoxins are highly toxic secondary metabolites produced by certain strains of Aspergillus flavus and Aspergillus parasiticus fungi. These toxins contaminate crops like maize, groundnuts, and other cereals, leading to severe health effects and economic losses.
Aflatoxin contamination continues to threaten food safety, public health, and market competitiveness in Kenya, particularly affecting rural maize farmers and low-income consumers. As temperatures rise and storage infrastructure remains weak, the spread of mold and aflatoxins in post-harvest crops becomes increasingly dangerous.
Where Does Contamination Happen Most?
1. Storage: High humidity, poor ventilation, and stacking of sacks in small spaces create perfect conditions for fungal growth.
2. Harvesting: Delay in harvesting and doing so during wet seasons traps moisture in crops.
3. Transport: Prolonged delays (e.g. border delays) under poor conditions increase risk.
4. Drying: Insufficient drying leads to moisture levels >14% — a key trigger for aflatoxin.
Key Enablers of Contamination
- High humidity (95%)
- Warm temperature (>28°C)
- High crop moisture
- Poor storage practices and low farmer awareness
BACKGROUND TO THE PROBLEM

Meet Mzee Ngumuo, a maize farmer in Kondoa. After harvest, he stores his maize in a small, poorly ventilated room of his house. He checks the grain regularly by eye and hopes that sun-drying and intuition are enough to prevent mold. Weeks later, he discovers the maize is spoiled contaminated with aflatoxins.
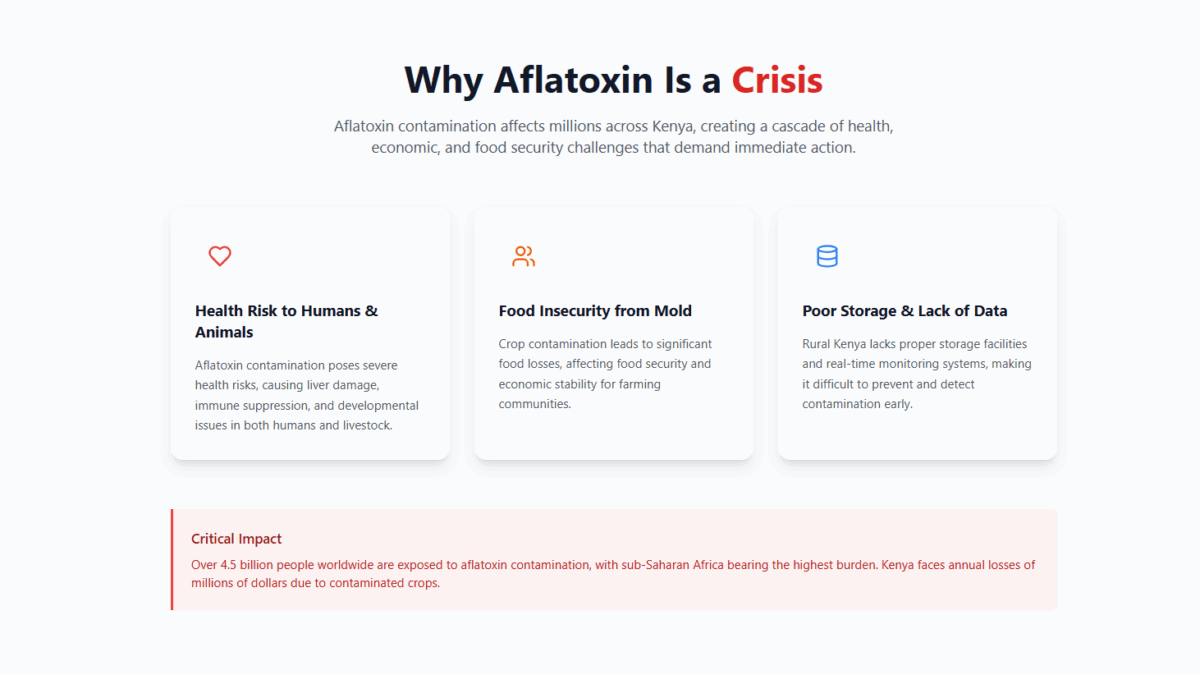
- Economic impact: He loses up to 43% of his harvest, directly affecting his income and food security for his family. On a regional scale, such losses reduce national productivity and limit access to safe food.
- Health impact: Contaminated maize enters the food chain, causing chronic illnesses, including liver disease and stunted growth in children. crucially there is a risk for liver cancer as the fungus has proven to be highly carcinogenic
This story illustrates the cost of inaction both financially and in terms of human health.
Existing systems for detecting aflatoxins rely on laboratory testing, which is expensive, centralized, and slow. Farmers must wait days or weeks to receive results often too late to salvage contaminated crops.
Previous Methods were Crude and Reactive
Traditionally, farmers rely on solar drying and visual inspections (“eye tests”) to detect contamination. While accessible, these methods are:
- Inconsistent and unreliable.
- Reactive rather than preventive.
- Unable to detect invisible contamination until it is too late.
There is an urgent need for prevention-focused, data-driven solutions.
Case Study: Kondoa Project
In Kondoa, an existing IoT setup was monitoring storage rooms:
- Temperature sensors tracked heat buildup.
- Hygrometers and moisture sensors monitored humidity.
- Fans and dehumidifiers responded to environmental changes, but required manual operation.
we participated in field deployment, helping place sensors and monitoring their readings. While the setup could measure conditions, constant manual supervision was necessary. Sensor logs were recorded, but decisions to ventilate or dehumidify were made manually, making the process reactive.
Observation: The hardware worked, but data was underutilized. There was no platform to process it for preventive action.
OUTLINING THE CHALLENGE
Develop a data collection and analysis tool to enable stakeholders to prevent and combat aflatoxin poisoning.
We refined this challenge into five core tasks:
- Collect reliable environmental data
- Analyze and process it automatically
- Deliver real-time alerts to field managers
- Visualize risks for decision-makers
- Predict future threats using machine learning
THE PREDICAMENT: Key Technical Challenges We Address
| Challenge | Our Approach |
|---|---|
| Low infrastructure areas | GSM/LoRa communication + solar-powered sensors |
| Lack of digital training | Simple SMS/USSD interfaces for silo managers |
| Fragmented data | Centralized, encrypted cloud database + local caching |
| Manual data interpretation | AI/ML models detect risk trends and generate insights |
| Inaccessible lab testing | Preventive alerts replace delayed detection |
| Poor visibility for stakeholders | Web-based dashboards with maps, graphs, and reports |
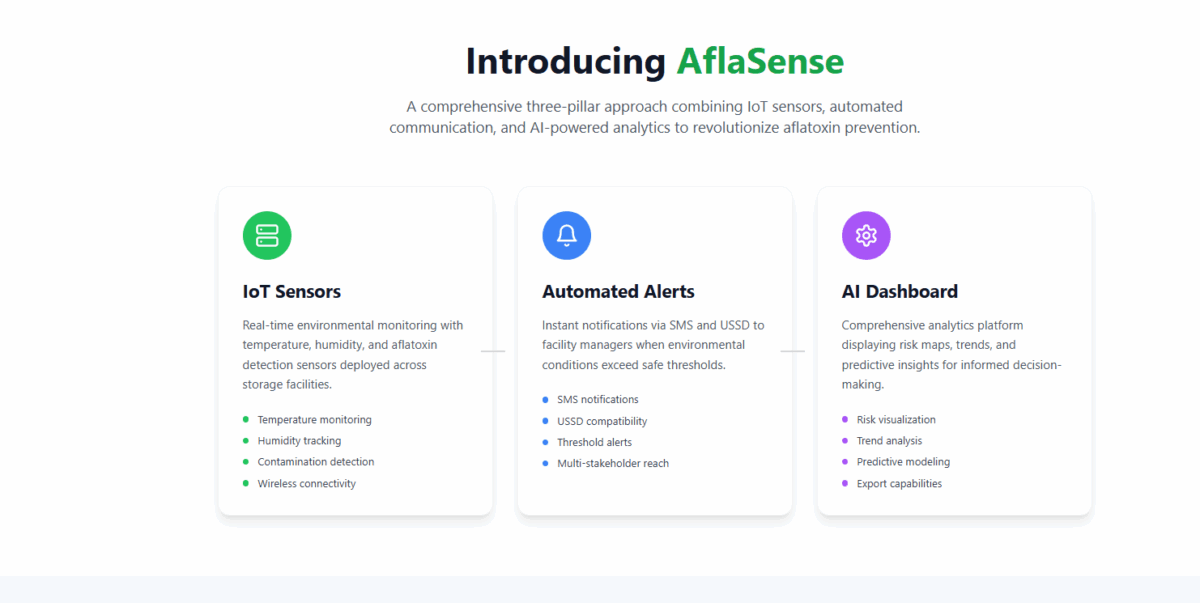
OUR VALUE PROPOSITION: AflaSense
AflaSense Platform
We developed AflaSense, a platform that taps into existing sensor networks to provide real-time monitoring, alerts, and predictive analytics. The platform transforms raw data into actionable insights, enabling stakeholders to prevent aflatoxin contamination before it occurs.
Prototype & System Functionality
To demonstrate the practical functionality of AflaSense, we built a working prototype integrating the existing IoT sensors in Kondoa silos. The prototype highlights the platform’s interface, workflow, and user interactions:
- Farmer Interface:
- SMS or USSD alerts triggered automatically when silo conditions exceed safe thresholds.
- Simple, actionable messages allowing farmers to ventilate, activate fans, or start dehumidifiers.
- Extension Officer Interface:
- Web-based dashboards showing current silo conditions, historical trends, and high-risk silos on interactive maps.
- Ability to generate reports for regional planning and intervention.
- NGO/Government Interface:
- Heatmaps of risk distribution across multiple sites.
- Predictive trends and analytical summaries for policy-making and targeted interventions.
Prototype Validation:
- Data from sensors (temperature, humidity, moisture) flows into the platform in real-time.
- Alerts, dashboards, and reports are generated automatically, demonstrating that the system can monitor, predict, and communicate risk without manual oversight.
- Field testing in Kondoa confirmed that the prototype accurately reflected environmental conditions and triggered actionable alerts, validating both the technical design and stakeholder usability.
Key Features:
Decision Support: Stakeholders can act proactively drying, ventilating, or moving grain before contamination spreads.
Data Integration: Connects to existing IoT sensors via APIs.
Predictive Analytics: Combines threshold logic (FAO standards) with ML models to forecast risk.
Alerts & Monitoring: Sends SMS to farmers, provides dashboard maps for extension officers, and regional analytics for NGOs/policymakers.
Technical Implementation
1. Data Collection
The AflaSense platform taps into existing IoT infrastructure deployed in silos and storage rooms.
AflaSense ingests data from existing IoT sensors already deployed in storage silos:
- Sensors Deployed:
- Temperature sensors: Track heat fluctuations in storage rooms.
- Hygrometers: Measure relative humidity.
- Capacitive moisture sensors: Detect dampness in grain sacks.
- Fans and dehumidifiers: Previously manually operated, now integrated for automated interventions in future iterations.
- Sampling Frequency: Every 15 minutes, providing granular environmental monitoring.
- Metadata Tags: Each reading includes silo ID, GPS location, and timestamp, ensuring traceability and contextual analysis.
- Field Validation: Team members participated in sensor deployment and monitored sensor accuracy to ensure reliable readings and prevent misreporting.
In a Kondoa silo, a temperature spike to 31°C was recorded while RH reached 90%. Previously, this would have gone unnoticed until manual inspection; now, the platform automatically identifies it as a high-risk event.
Value: By leveraging existing sensors, we avoid costly hardware deployment and focus on extracting actionable intelligence from the raw environmental data.
2. Data Processing & Storage
Once collected, the data flows into the cloud infrastructure for processing:
- Data ingestion: Sensor readings are sent via GSM/LoRa to API endpoints hosted on a cloud server.
- Data structuring: Incoming JSON packets are standardized with tags for silo ID, location, and timestamp.
- Local and cloud backup: Local caching ensures no data is lost if network connectivity is intermittent. Cloud storage AWS stores long-term sensor history.
- Security: All data is encrypted in transit and at rest. Role-based access ensures only authorized users view or manage silo-level information.
The 31°C spike is logged with timestamp, location, and silo ID. It is automatically stored and backed up, ready for analytics and dashboard visualization.
Value: Centralized storage allows stakeholders to see trends over time, compare silos, and generate predictive insights that were impossible with isolated manual logs.
3. Analysis & AI Integration
AflaSense is not just a data collector it turns raw data into predictive intelligence:
- Threshold-based logic: Sensor readings are compared against FAO guidelines (e.g., RH >88% triggers risk).
- Predictive modeling: Time-series models ( LSTM) forecast environmental conditions likely to trigger aflatoxin.
- Risk classification: Decision trees categorize silos as low, medium, or high(critical) risk.
- Trend detection: ML models identify patterns like mold incubation or humidity spikes, enabling early preventive action.
- Future AI integration: We plan to train custom GPT models to analyze long-term trends, correlate environmental data with farmer interventions, and provide narrative insights for policymakers.
Predictive analysis estimates that if the temperature remains above 30°C and RH above 88% for 12 hours, aflatoxin risk rises by 60%, prompting a proactive alert to the farmer.
Value: Stakeholders don’t just react to conditions they anticipate risk and make informed decisions.

4. Alerts
Aflasense converts analysis into timely notifications for all stakeholder levels:

- Extension officers:Receive SMS or USSD alerts if silo conditions exceed risk thresholds ,dashboards highlight which silos need immediate attention, along with location maps.
- NGOs and policymakers: Regional summaries, trend reports, and heatmaps help plan interventions.
- Automation: Alerts are triggered automatically by cloud-based workflows without manual oversight.
After the 31°C spike, the farmer receives an SMS: “High humidity and temperature detected in Silo #3. Please ventilate or activate fans. Risk of aflatoxin contamination rising.”
Value: Preventive alerts reduce dependence on human monitoring, lowering the risk of unnoticed contamination.
5. Data Visualization
Dashboards provide multi-level insights:
- Live data feeds: Real-time updates of silo conditions and environmental readings.
- Historical trends: Interactive graphs showing temperature, humidity, and moisture over time.
- Predictive maps: Geographic heatmaps identify high-risk areas across regions.
- Report generation: Exportable PDF, CSV, or XLSX reports for regulatory or NGO reporting.
Value: Visualization converts complex data into easy-to-understand insights, supporting proactive decision-making.

Operational Workflow
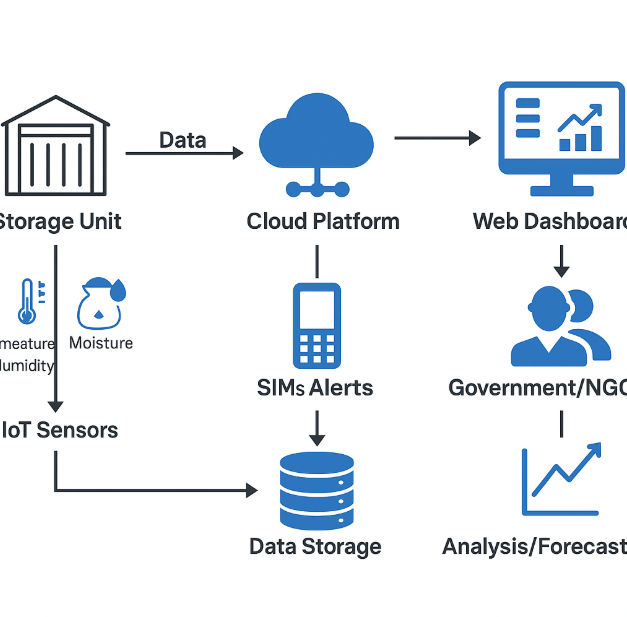
Here’s how all components interact to form a fully integrated preventive system:
- Sensors Record Conditions
- Temperature, humidity, and moisture readings are captured every 15 minutes.
- Metadata ensures traceability and contextual relevance.
- Local Caching & Cloud Transmission
- Data is temporarily stored locally on the sensor device.
- Periodically uploaded via GSM/LoRa networks to the cloud API.
- Data Structuring & Storage
- Cloud ingestion services standardize JSON packets.
- Encrypted storage ensures long-term safety and accessibility for analysis.
- Analysis & AI Layer
- Threshold-based logic flags immediate risks.
- Predictive models forecast future risk based on environmental trends.
- Decision trees classify silo risk levels (low/medium/high).
- Long-term trends are logged for machine learning models to refine future predictions.
- Alerts Generation
- Automated triggers send SMS or USSD messages to farmers.
- Dashboards update in real-time for extension officers.
- Regional heatmaps and trend reports are generated for NGOs and policymakers.
- Visualization & Reporting
- Interactive dashboards show current and historical trends.
- Users can download reports for analysis or compliance purposes.
- Feedback Loop
- Farmers or officers can report on actual conditions (e.g., mold spotted, fans turned on).
- Feedback is fed into ML models to improve predictive accuracy over time.
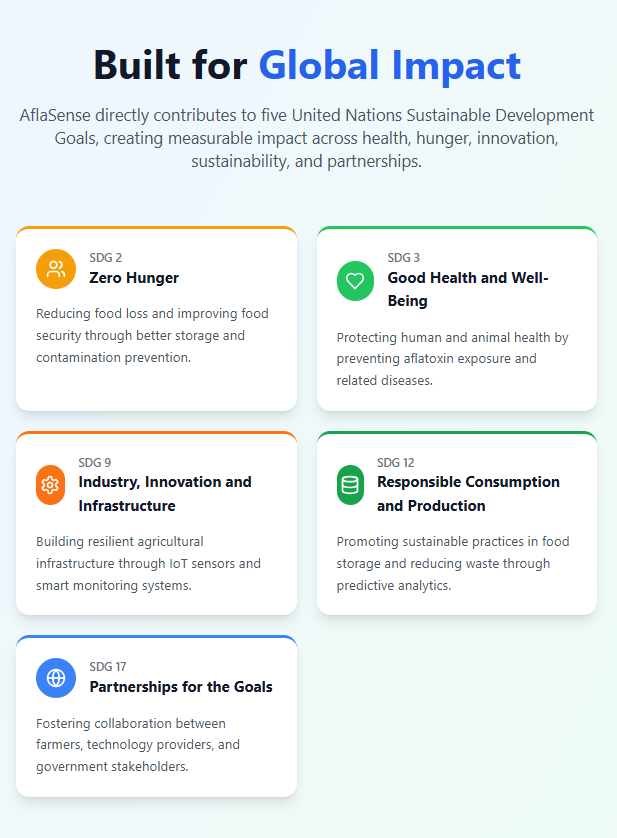
SDG ALIGNMENT
Implementation Roadmap

- Phase 1: Pilot in Kondoa — integrate platform with existing sensors, train local users, collect feedback.
- Phase 2: Regional expansion — scale to more silos, multi-language support.
- Phase 3: National deployment — dashboards for government/NGOs, integration with food safety programs.
- Phase 4: Cross-border expansion — integration with regional agri-tech ecosystems.
Performance Targets
- Reduce undetected aflatoxin risk by 40% in pilot sites.
- Cut manual monitoring time by 50% for extension officers.
- Improve farmer response time from days to hours.
Stakeholder Requests

- Farmers: Affordable, actionable SMS alerts.
- NGOs: Access to risk data for intervention planning.
- Government: Dashboards for policy decisions.
- Partners: Open APIs for integration with other agri-tech solutions.
Business Model

Call to Action
In Kondoa, AflaSense transformed underutilized IoT sensor data into actionable prevention against aflatoxin. By automating monitoring, delivering predictive insights, and providing stakeholder-specific dashboards, we’ve shown that prevention is possible.
We invite NGOs, policymakers, and agri-tech partners to collaborate in scaling AflaSense safeguarding harvests, improving public health, and securing farmer livelihoods across Kenya and beyond.